As part of my involvement as a senior digital strategist (contract) with Think Shift, I publish an annual report on digital advertising benchmarks.
When you look for industry data, agriculture is often overlooked (or perhaps underserved), and this report was born out of a desire for quality benchmark data on advertising for agriculture.
The report is built based on the digital advertising data that Think Shift has access to, combining years of performance data across search, social, video and display placements for agriculture clients targeting farmers in North America.
I have summarized some of the key information below, but for the full report visit the Think Shift website.

Clickthrough Rate
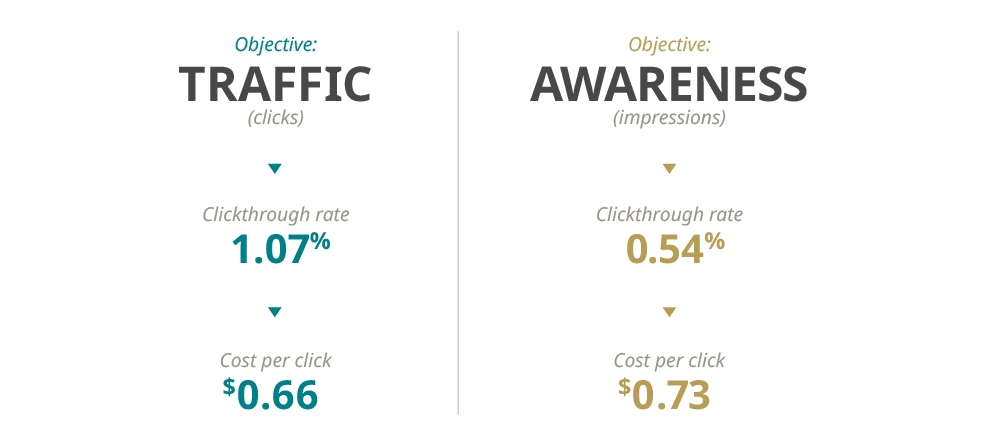
Clickthrough rate is a typical advertising metric that measures the percentage of impressions that lead to a click. The average clickthrough rate for digital ads in the ag industry is 5.74% for search, 0.47% for display, and 0.48% for social advertising.
Cost Per Click
Cost per click (CPC) is the average price that an advertiser pays to drive a single click on a digital advertisement. This measures how efficiently an ad or campaign can deliver clicks. The average CPC for digital ads in the agriculture industry is $2.19 for search, $0.64 for display and $0.96 for social advertising.
Cost Per Mille
Cost per mille (CPM) is the average cost to deliver 1,000 impressions, and measures how efficiently an ad or campaign delivers impressions. Most direct-to-publisher advertising is charged on a CPM basis, so advertisers purchase impressions in blocks of 1,000. CPM allows us to measure the efficiency of awareness-based campaigns. The average CPM for the agriculture industry is $3.00 for display, $4.62 for social and $24.45 for direct-to-publisher (we don’t typically report on CPM for search campaigns, as they are always focused on clicks or conversions).

